Introduction
There are numerous different resources that prospective voters can use to track an election. Almost every new outlet has their own poll, and major election tracking sites, like FiveThirtyEight, are publicly available for anyone to monitor. There’s great debate surrounding the purpose and benefit of polls. These polls are especially useful for campaigns to track shifts in their support between states and districts. It can also allow citizens to see how fellow Americans are reacting to current events across the country. However, polls have significant limitations. Sampling errors, biased methodologies, and low response rates can skew results. Additionally, they may influence voter behavior who can see one candidate drastically succeeding in their state, convincing them to stay home on election day. Unexpected events or late voter shifts can drastically alter outcomes, making predictions unreliable, but they are still a useful resource for researchers to predict election outcomes based on history and voter preferences.
In this week’s blog, I will be using individual polling sites to see how outcomes differ over time, as well as creating my own model based on these polls.
Poll Ratings Grade Distribution
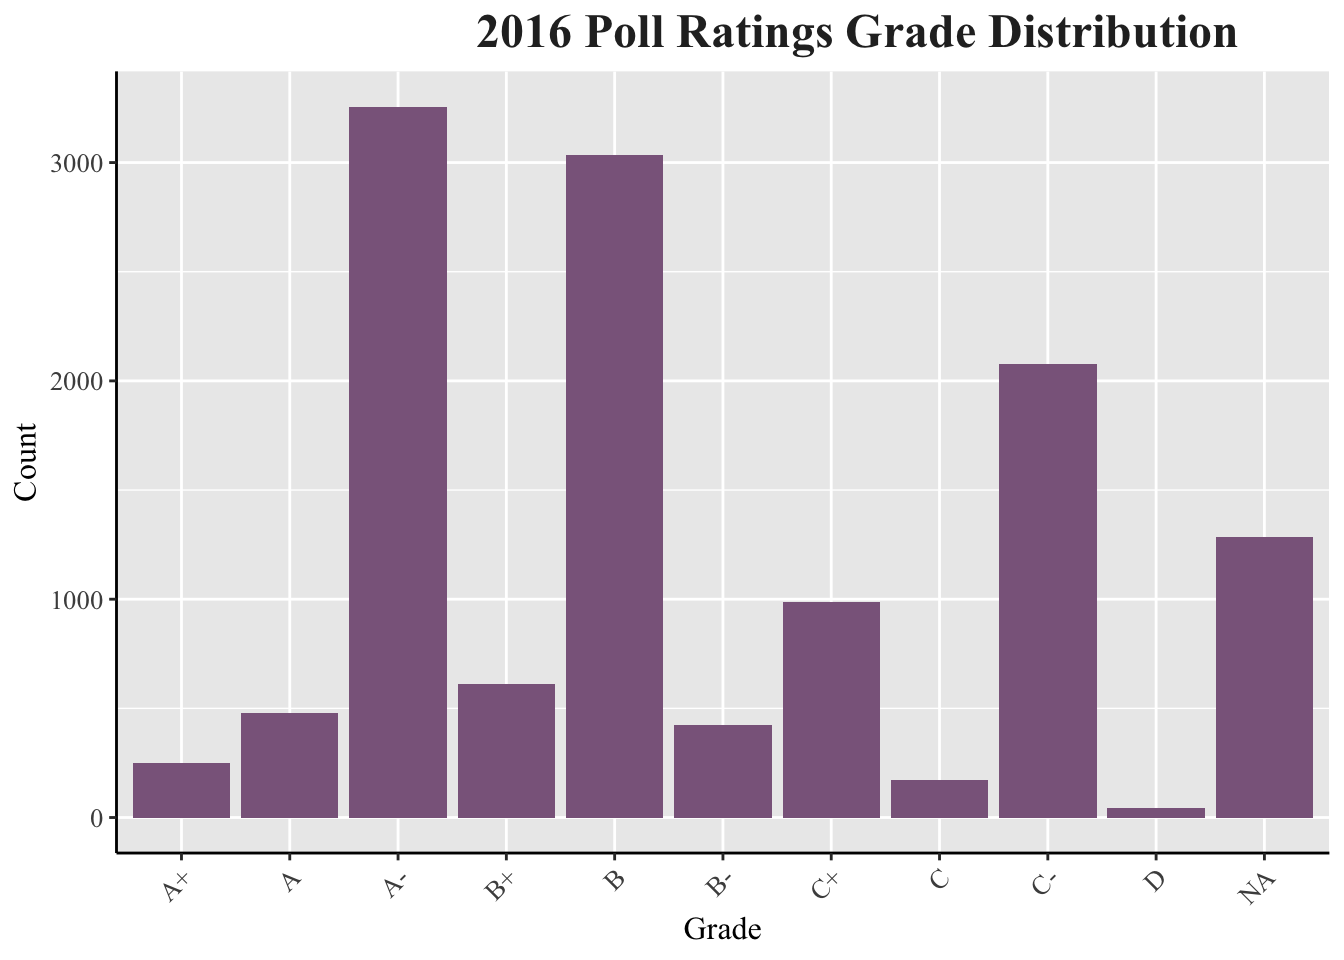
Among the 2016 presidential election polls provided this week, letter grades were designated to disclose their reliability. The most common poll grades were A-, B, and C-, respectively.
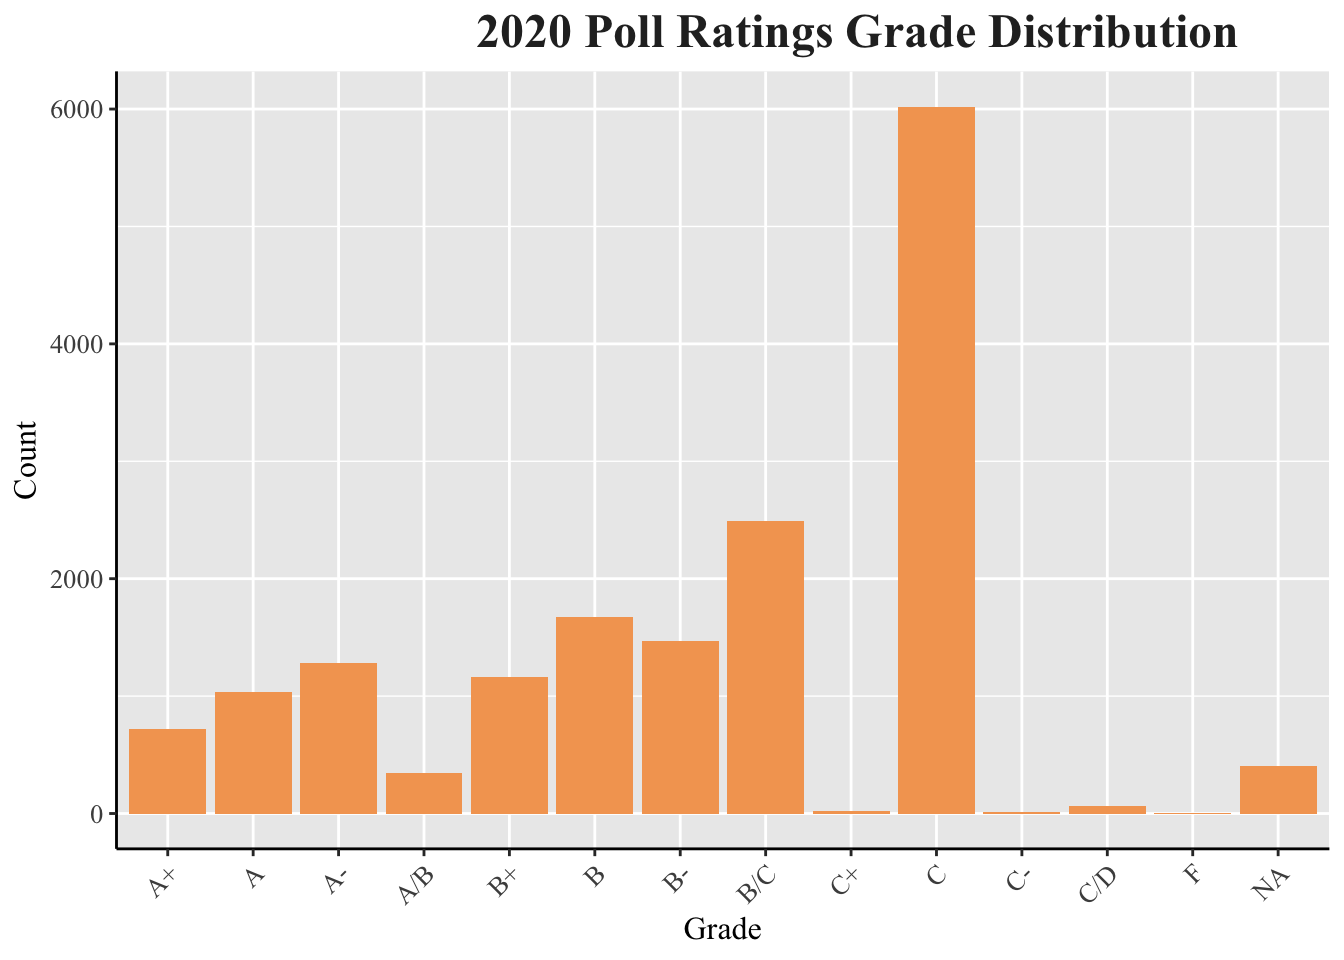 In 2020, the most common letter grades for the polls provided was overwhelmingly C, with a distant second of B/C. The letters grades are significantly lower graded than in 2016, and the distribution is left skewed.
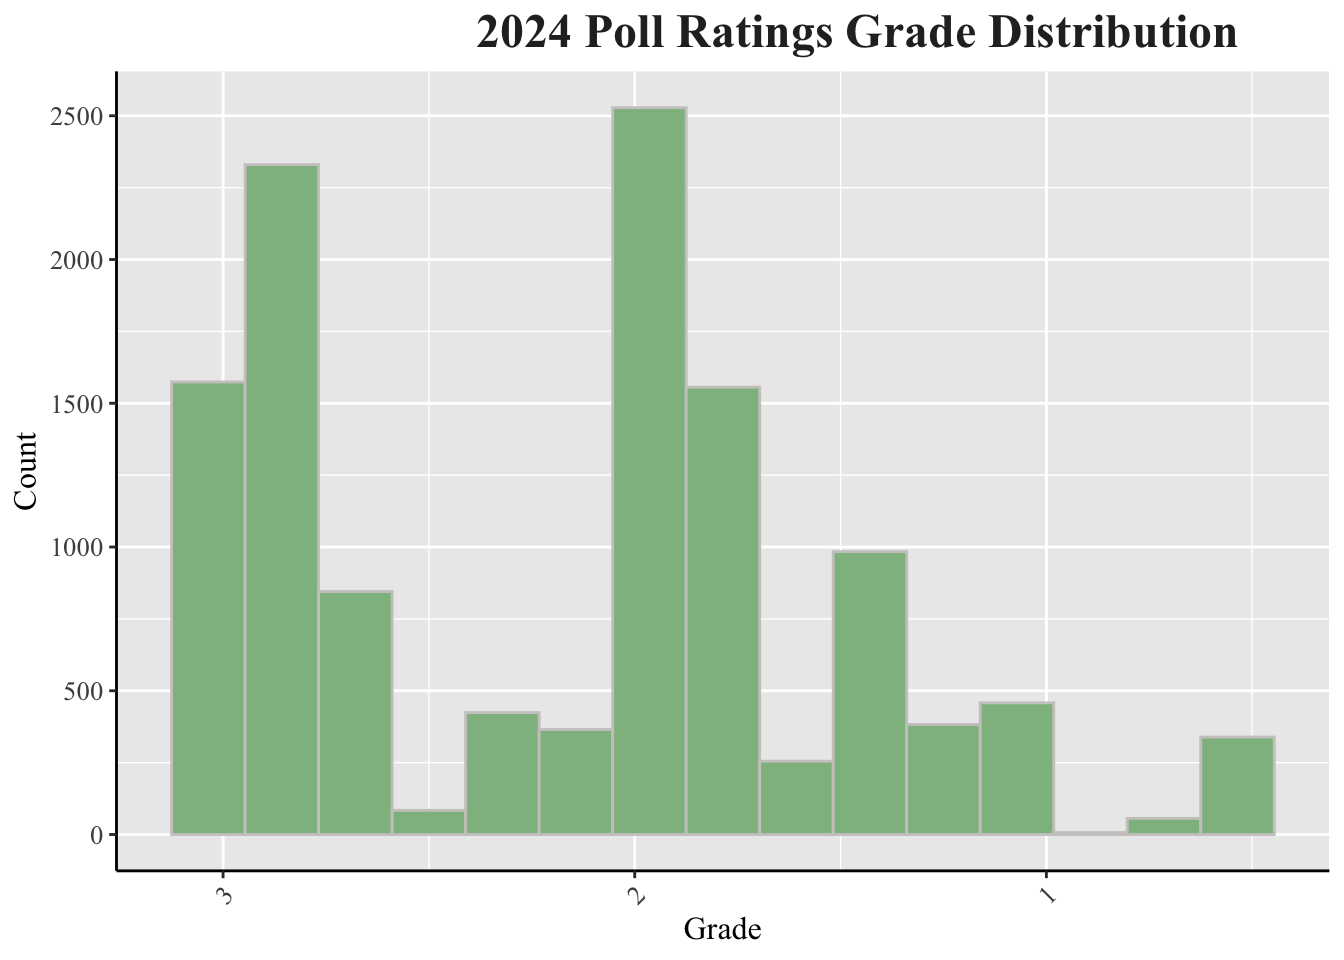 The grading scheme changes for 2024 to a 1-3 scale with 3 being the highest rating. There's a heavy emphasis on the higher score between the 2 and 3 range.
Polling Averages
## `geom_smooth()` using method = 'loess' and formula = 'y ~ x'
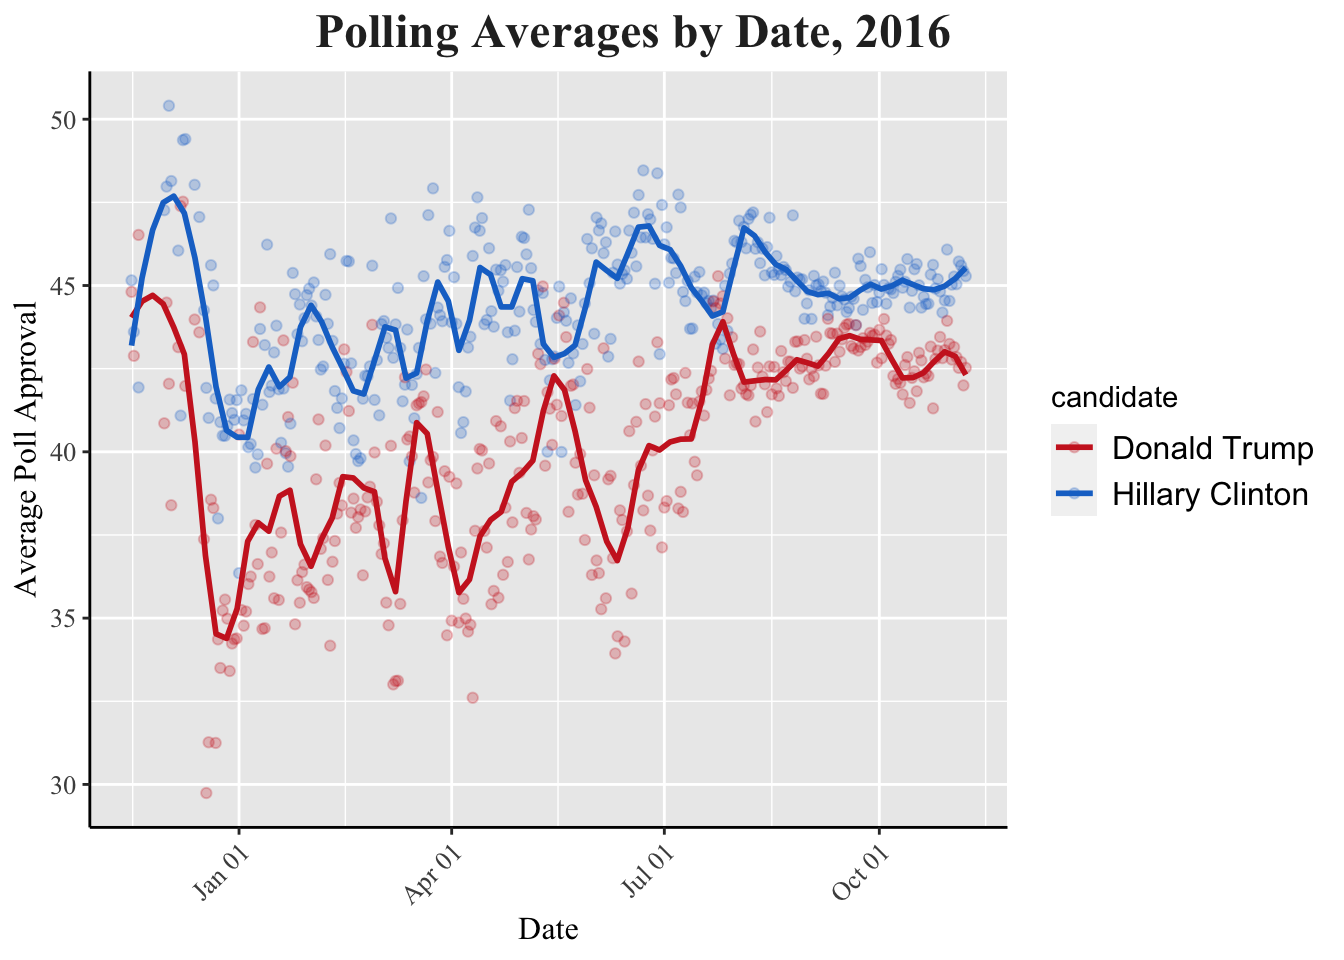
The graph above tracks poll approval ratings for Trump and Clinton for about one year before election day. After averaging the different 2016 polls, I was able to mark a point for everyday over the year before Election Day to see how predictions changed. There a few notable trends in this chart. For starters, there is a drastic dip in December 2015 for Trump. This sink in polls can likely be attributed to Trump calling for a complete shutdown on Muslim people entering the United States seeking refuge or citizenship. Additionally, before February 2016, the candidates followed each other in poll approval, meaning they rose and sunk together. Afterwards, their votes began to diverge, so when Clinton did well, Trump did not, and vice versa. This is because the party primaries began in 2016, so both parties had great division between nominees. The Republicans lost a more moderate Ted Cruz and Marco Rubio, while the democrats lost a more progressive Bernie Sanders.
## `summarise()` has grouped output by 'enddate'. You can override using the
## `.groups` argument.
## `geom_smooth()` using method = 'loess' and formula = 'y ~ x'
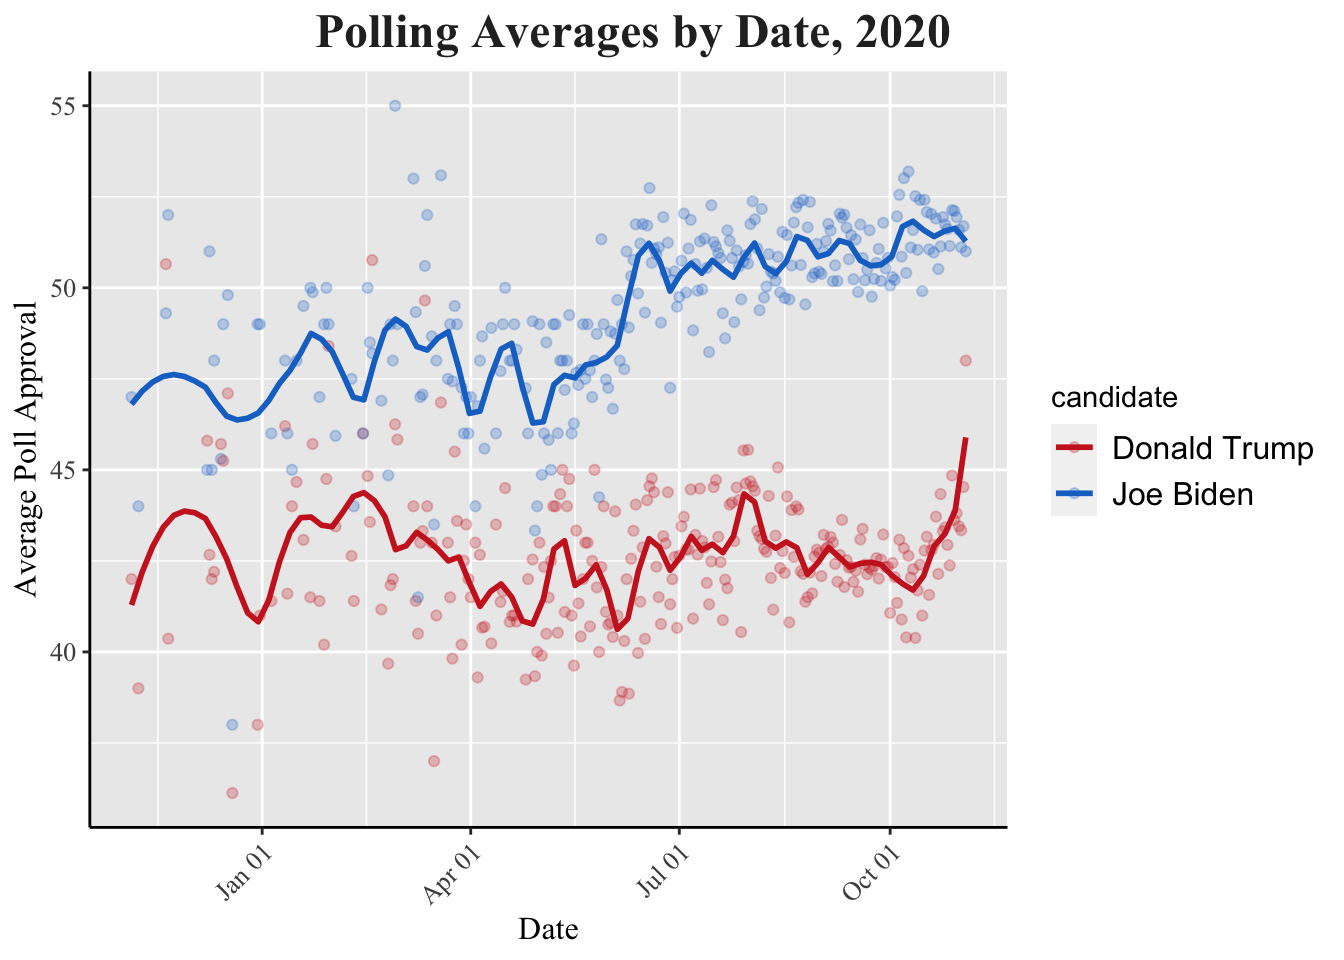 The 2020 poll approval chart does not display extreme dips and peaks like in 2016. There is a similar trend that follows before and after the primaries, but not as drastically, since there were no major candidates running against Trump in 2020. The polls find their predictions converge near election day, unlike in 2016 as well. Between April and July, Trump struggled to consistently raise his approval, as the COVID-19 pandemic was endangering millions of Americans everyday. George Floyd's death in May also sparked the beginning of the Black Lives Matter movement, which the former President had been unable to empathize with or address, explaining his low rating.
## `summarise()` has grouped output by 'enddate'. You can override using the
## `.groups` argument.
## `geom_smooth()` using method = 'loess' and formula = 'y ~ x'
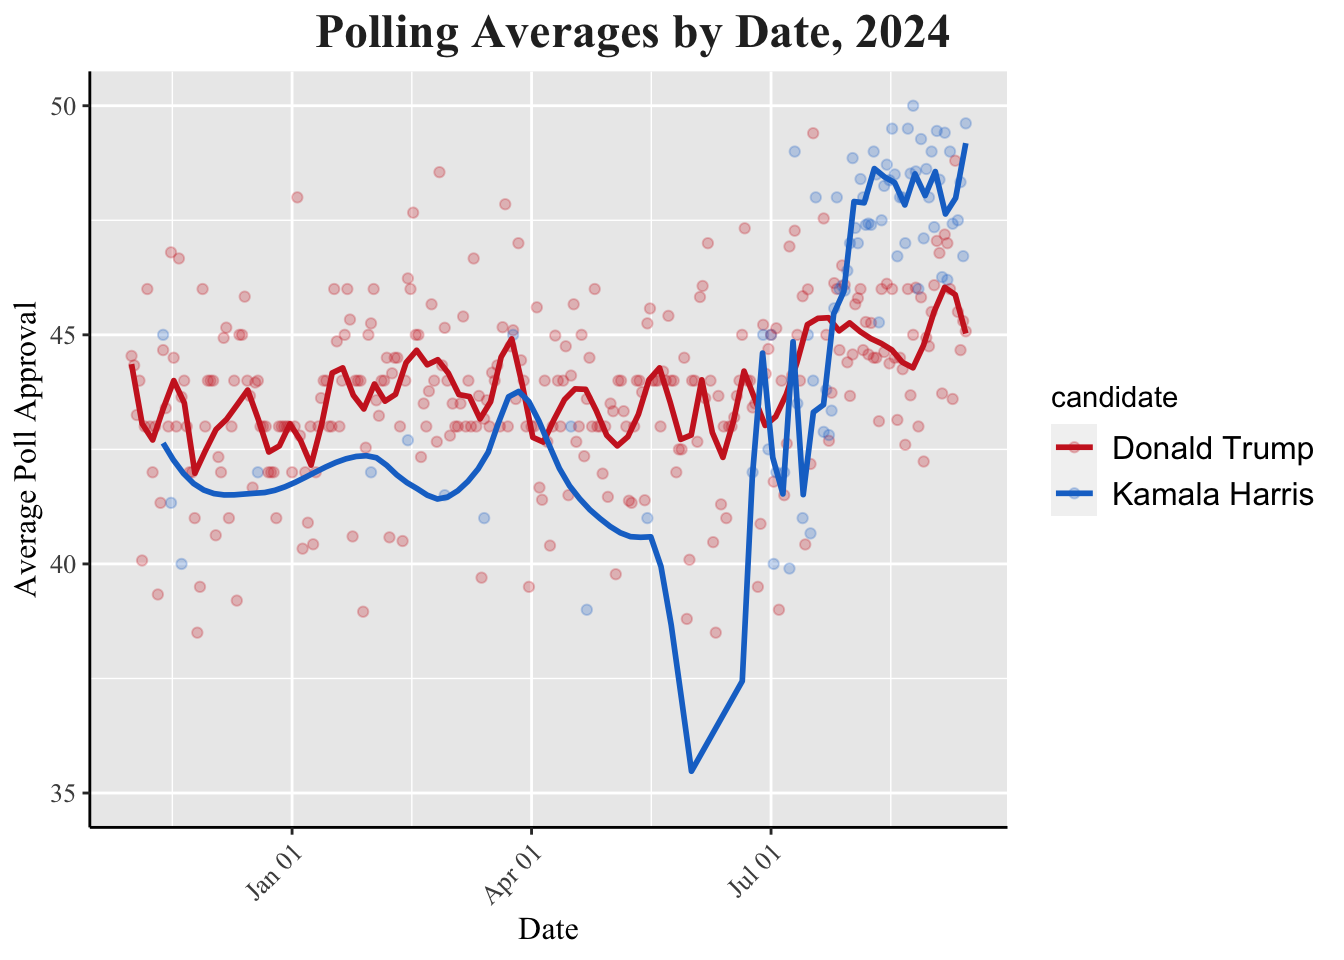 The chaos of 2024's polls represents the chaos that has undergone politics over the past year. The blue line represents President Biden's polls until July 21, 2024 when he drops out of the race and endorses Kamala Harris. Trump and Biden generally matched each other, staying between the 40-45% approval range. However, after a disastrous first debate at the end of June, Biden's polls sink to 35%. Immediately after he drops out in July, the Democratic Party jolts upwards and continues to have a comfortable lead above Trump, despite the age of Harris' campaign, especially following the Democratic National Convention.
Comparing Nate Silver and G. Elliott Morris
Nate Silver created the original FiveThirtyEight model that relies on looking at many different individual polls. Further away from Election Day, Silver relies on a prediction from the weighted average of the different polls, based on their pollster rating and sample size. Closer to Election Day, the trend line method puts greater emphasis, so polling averaging is less conservative. These adjustments for averaging include, likely voters, house effects, and age of polls. There’s also adjustment to mitigate the upward bounce in polls following party conventions. Demographics are accounted for, but Silver believes fundamentals (ie. economic factors) cause too much noise to be heavily reliant on. This year, Silver made a few adjustments including the exclusion of COVID-related factors, serious third party candidates, “rematch elections”, and ranked choice voting states.
G. Elliott Morris, who currently runs the FiveThirtyEight model, also uses a weighted average for his polling prediction, but he changed the two factors deciding its weight. Morris uses the 538 pollster rating score and the frequency of surveys the pollster has released in a short period of time. This contrasts Silver who uses sample size instead of history. Morris also now uses the Bayesian multi-level dynamic linear model, meaning his model takes polls, weights polls, adjusts polls, and averages polls simultaneously. The adjustments Morris includes have some overlap to Silver in third party candidates, house effect, and likely voter effect. However, he also includes mode of survey and partisanship adjustment. Morris also introduced a state effect adjustment that essentially looks at individual state polls/trends, and uses them predict the effect on a neighboring state.
Morris has greater emphasis on the fundamentals, which Silver labels as “too noisy.” Morris has about a dozen political and economic indicators, which Silver worries about leading to “over-fitting,” to address uncertainty that comes from just looking at polls.
Sources
I collaborated with Sammy Duggasani and Nick Dominguez to create this week’s blog and polling presentation.
(https://muslimadvocates.org/wp-content/uploads/2019/06/Timeline-of-Record-of-Bigotry.pdf).